Introduction
The first activity was to create an elevation surface and
record points on the surface using X, Y, and Z fields. The elevation surface
was made in a planter box/sandbox. Each group had to make land features. These
features were a ridge, a hill, a depression, a valley, and a plain. The box was
separated into grids which were the group’s X and Y points. The X points were
either the highest point of a square or the lowest point depending on the
elevation feature.
Methods
The first step for the activity was to create a coordinate
system. Our group marked out 8 centimeter incriminates on the box. Our X
coordinates were the width or the short-side of the box with the length or
long-side being our Y coordinates. The group ended up with 13 points on the X
and 29 on the Y. The top of the box was used as sea level.
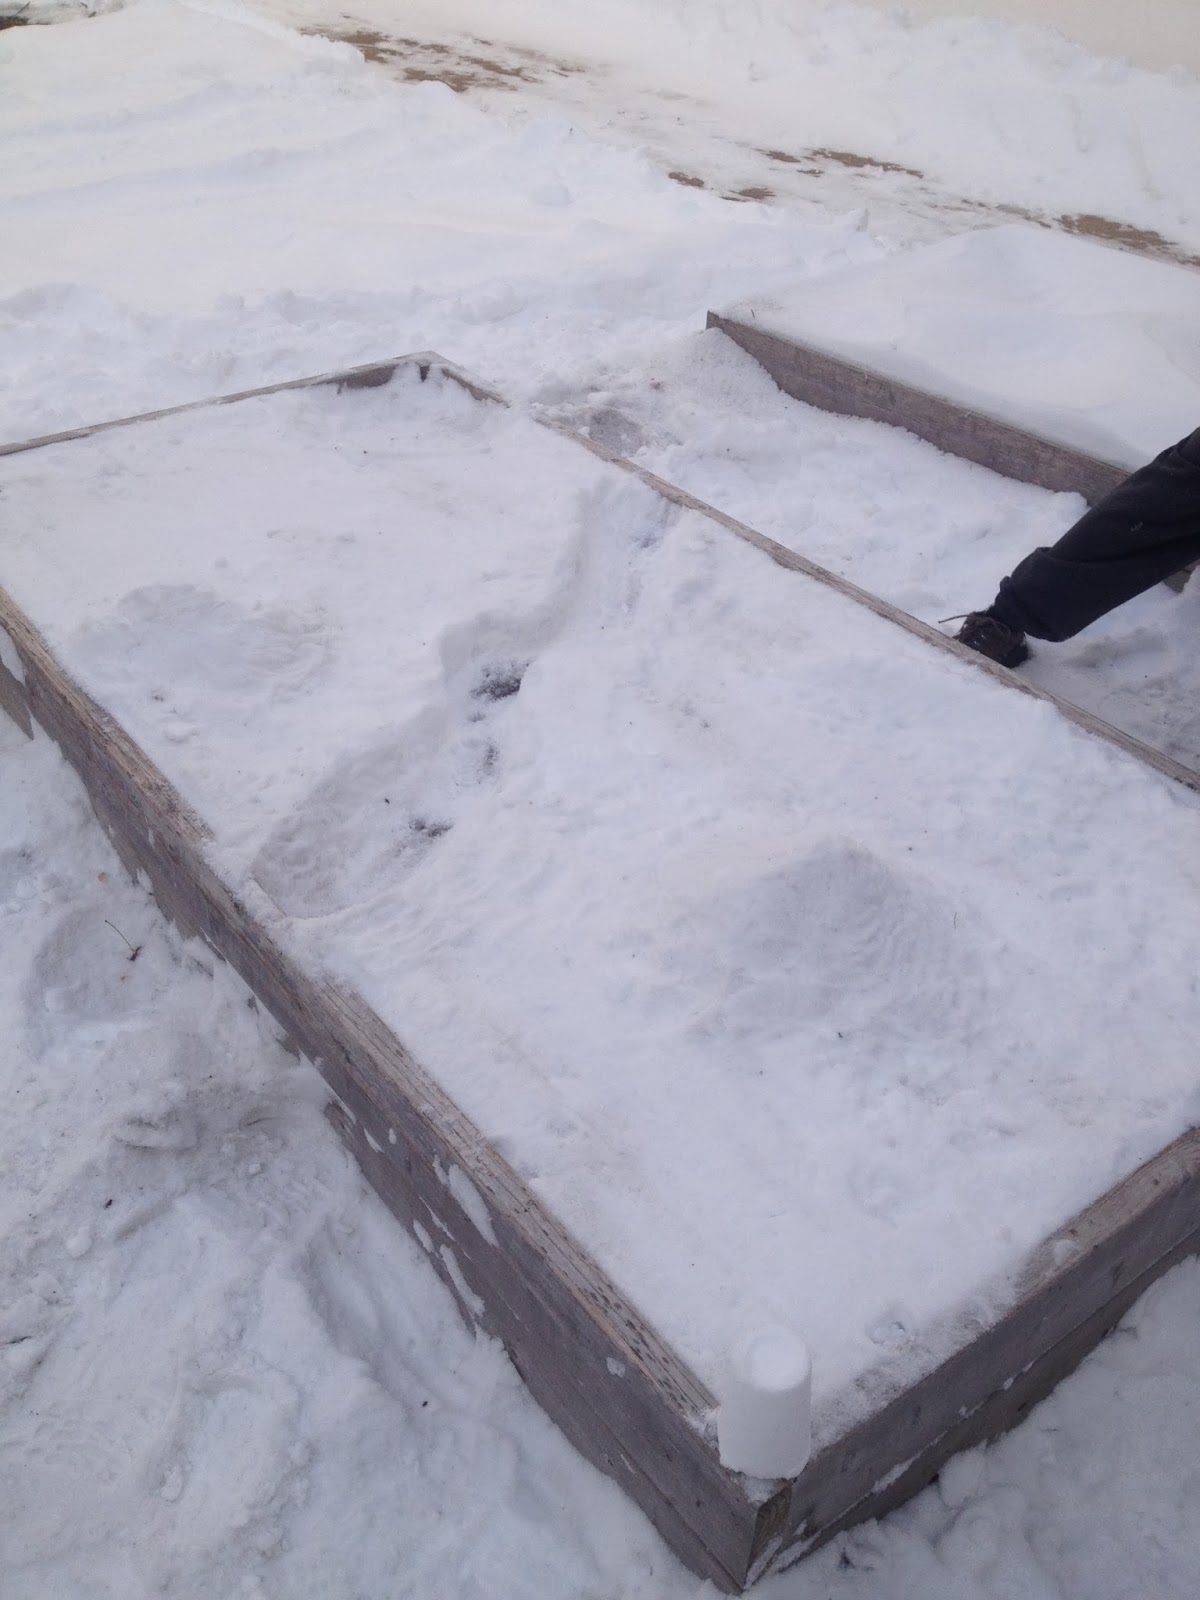
Photo 1: The planter box before surface creation
The next step was to create the features. Again, these
features were a ridge, hill, depression, valley, and plain. The group compacted
the snow to higher elevations to create the ridge and hill, the valley was
created by making a meandering feature at low elevations, the depression was
created by digging down below the designated sea level, and the plain was made
flat at sea level.
Photo 2: Completed surface
After the creation of our survey area the group made a grid.
The grid was made using the 8 centimeter incriminates and string. The string
ran across the X and Y coordinates. The grid was used to locate the elevation
of the X and Y coordinates. The group used centimeters on a meter stick to
record the elevation. The elevation range was from -12 cm to 14 cm. To measure
the elevation our group used the base level and either added for the ridge and
hill or subtracted for the depression and valley. The plain was consistent at 0
throughout.
After the data collection we entered all the data into an
Excel spreadsheet and formatted it for importation into ArcGIS.
Photo 3: Completed surface with grid
Discussion
This was activity was very interesting and fun to do. Even
though it was cold I feel that our group had a solid area made. I have never
done anything like this before and it will be useful to have when I look for
further endeavors. I think that using negative numbers worked well because then
we can see the spread of elevations much easier in Arc. The toughest parts were
the cold and the snow which had a hindrance of the project from the get go.
Conclusion
The exercise was a good learning experience which is always
useful. Using a grid for X and Y coordinates a good idea. Collecting data like
this brings a whole new knowledge and experience to people. I am willing to bet
that not many have done this before. The next step is to place all the points
into Arc and create various elevation models.


No comments:
Post a Comment